001 The Summary
Most development teams are running four or five observability tools in parallel: one for errors, one for session replay, one for analytics, one for uptime, sometimes one for performance. Each has its own SDK to instrument, its own alert system to configure, and its own dashboard to check when something breaks at 2am. When an incident fires, the path to a fix runs through all of them.
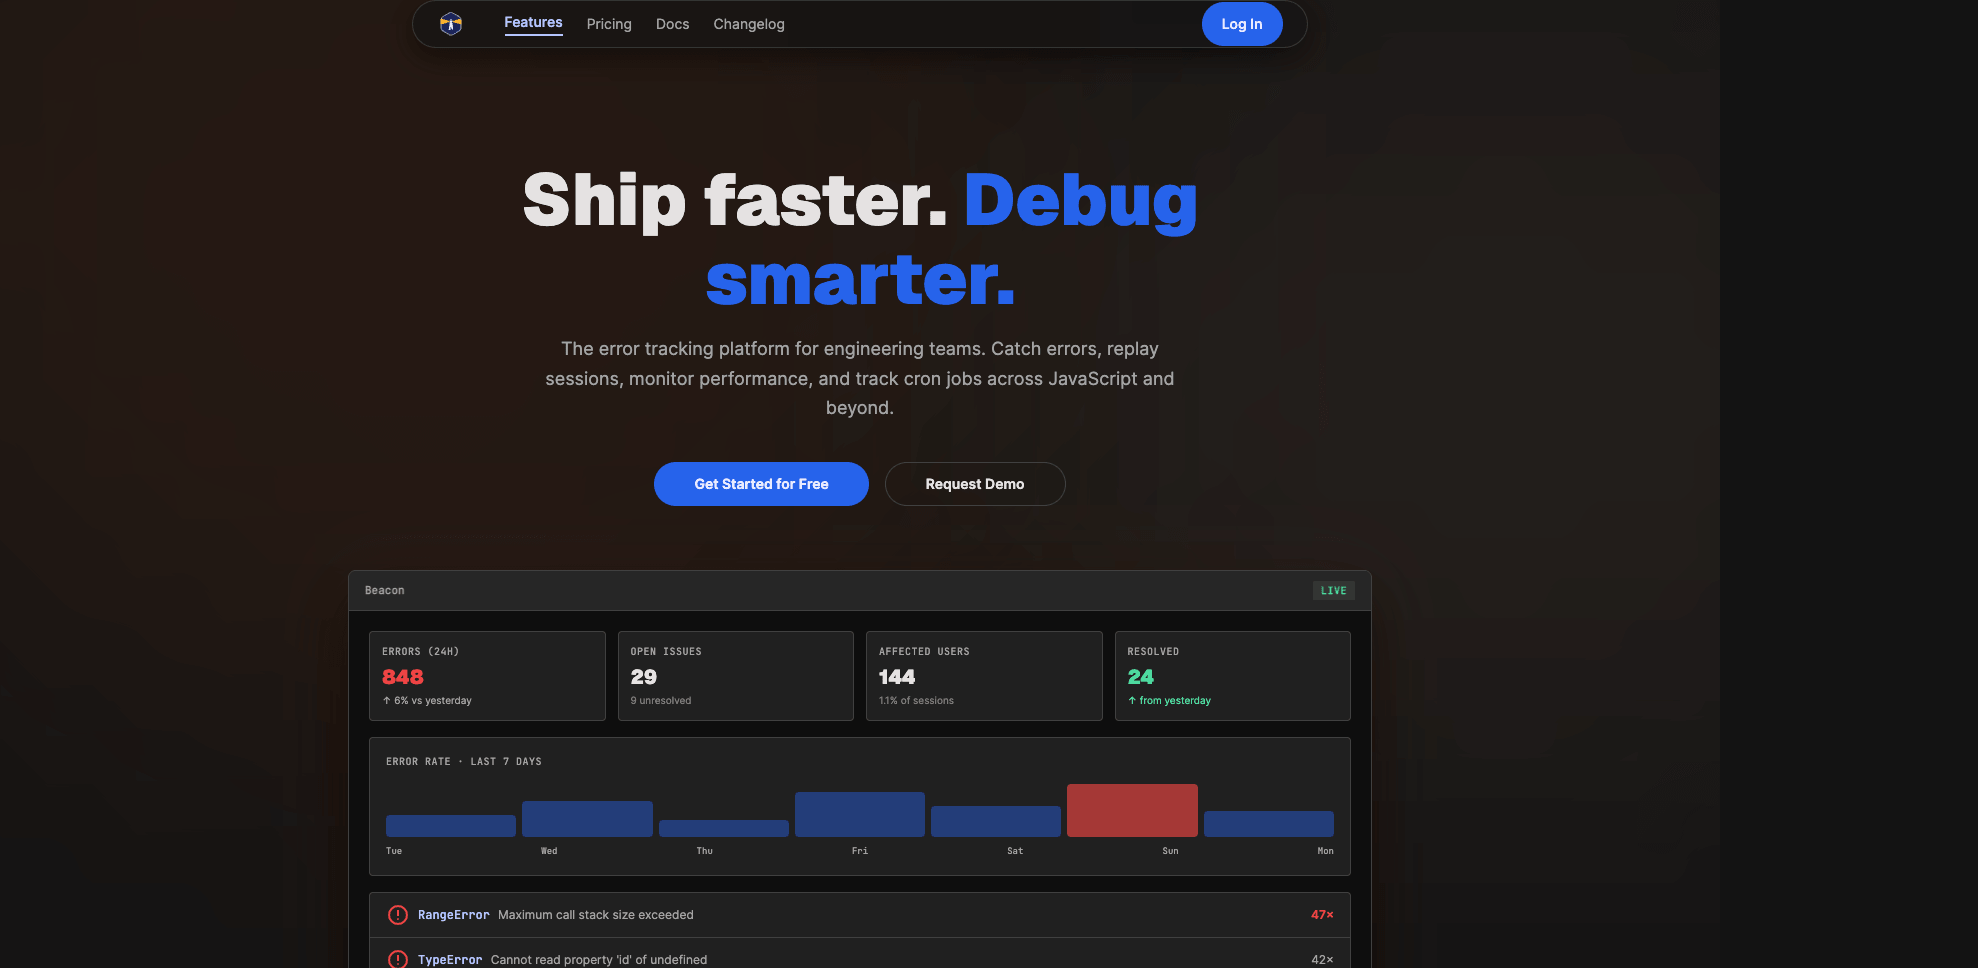
BeaconHQ replaces the whole stack with a single platform. Error tracking, session replay, web analytics, performance monitoring, uptime checks, and user feedback all live in one place. One dashboard. One SDK. The path from alert to fix gets as short as it can be.
Jetpack Labs designed and built it.
002 The Client
BeaconHQ is a Jetpack Labs product, designed and engineered in-house. The target user is the development team paying for Sentry, LogRocket, Google Analytics, and a status page tool separately, and looking for a way to consolidate without giving up depth in any category.
003 The Challenge
The observability problem for most teams is not a shortage of tools. It is the cost of running too many of them simultaneously.
Every tool in the stack requires its own SDK, its own configuration, its own alerting rules, and its own on-call workflow. When an incident fires, the investigation spans multiple dashboards. An error in Sentry links to nothing. A session replay in LogRocket has no error context. Analytics in Google Analytics have no session correlation. Uptime in a separate tool has no deployment context. The data that would let you understand the incident faster is split across systems that were never designed to talk to each other.
The build challenge was depth across every category without compromise: fingerprint-based error grouping as good as Sentry, analytics as complete as a dedicated tool, and session replay correlated directly to error events.
004 The Platform
BeaconHQ is built on Laravel 13, Vue 3 + TypeScript, PostgreSQL, and Laravel Reverb for real-time WebSockets. Queue processing runs via Laravel Horizon. Auth uses Laravel Sanctum with session cookies for the dashboard and API keys for SDK ingest. The platform is multi-tenant from the ground up, with full workspace isolation and role-based access (owner, admin, member) across projects.
The architecture has a dedicated relay layer: a lightweight standalone ingest service that accepts all SDK payloads and forwards them to the main API. Teams that need edge deployment or IP-restricted ingest use the relay without touching the core platform.
Five SDKs cover the instrumentation surface: Browser JS (IIFE and npm, auto-instruments errors, XHR, fetch, console, navigation, analytics, replay, and web vitals), PHP, Laravel, Node.js, and Python. All five are zero-dependency and share a consistent API surface.
The platform is organized around three observability layers:
Incident intelligence. Error tracking built around fingerprint grouping (MD5 of the normalized stack) rather than raw deduplication, giving issues stable identities across deployments. Every event captures a full breadcrumb trail: XHR, fetch, console, navigation, and custom events, in sequence. Source maps are applied automatically at ingest time, so production stack traces read as clearly as local development. Session replay records user events as a structured stream tied directly to error events, so you can jump from the issue to the exact session that triggered it. Ownership rules use glob-pattern file path matching to auto-assign new issues to the right team member. Issue workflow supports merge, bulk resolve, threaded comments, and saved views.
Operational health. Uptime monitoring covers both HTTP endpoint polling and cron heartbeat monitors. All 7 Core Web Vitals tracked per page and per release: CLS, FCP, FID, FMP, INP, LCP, TTFB. Release health surfaces per-deploy issue stats, regression counts, and affected users. The moment a bad deploy lands, it shows up. Alert rules fire on first occurrence, regression, or event threshold, routed to Slack or PagerDuty. Public status pages per project, shareable with customers during incidents, with no separate tool required.
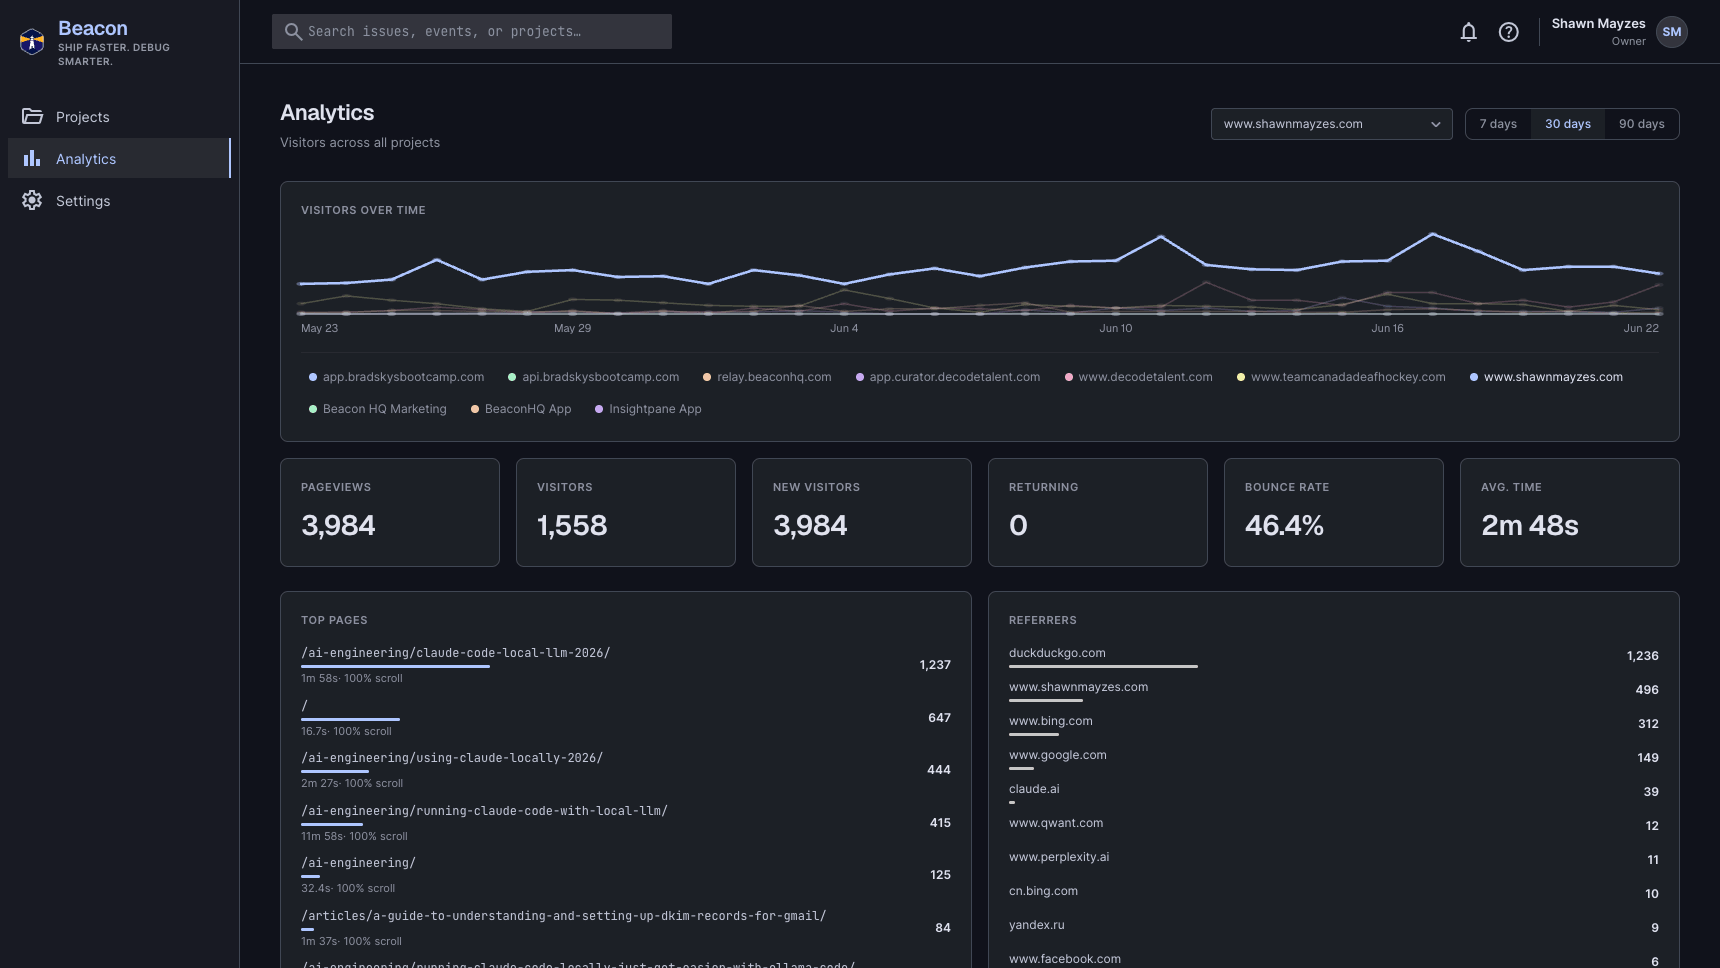
User intelligence. Cookie-free first-party analytics using sessionStorage sessions rather than tracking cookies. UTM parameter tracking (source, medium, campaign, term, content). Geo data (country, city, region), device data (browser, OS, screen dimensions), and engagement signals (scroll depth, returning visitor detection, session duration). Realtime view shows active visitors and top pages in the last 5 minutes. Pre-aggregated rollups keep queries fast at scale. Custom event support tracks any meaningful user interaction without a third-party vendor script.
005 The Build
Here is what an incident looks like on BeaconHQ.
An error fires at 2am. An ownership rule matches the stack frame filename to your file, so the Slack alert routes to your channel, not a generic #alerts. You click through to the issue: fingerprint group, error level, first and last seen, event count, affected users. You expand the stack trace. Source maps were applied at ingest, so you see your original file and line number, not the minified bundle. You scroll down to the breadcrumb trail: XHR requests, navigation events, console output, everything that happened in sequence before the crash. You click session replay and watch exactly what the user did. You check release health: this issue first appeared after the last deploy, and three other issues regressed at the same time. You push a fix. The issue auto-resolves. You did all of that in one tool, one login, one dashboard.
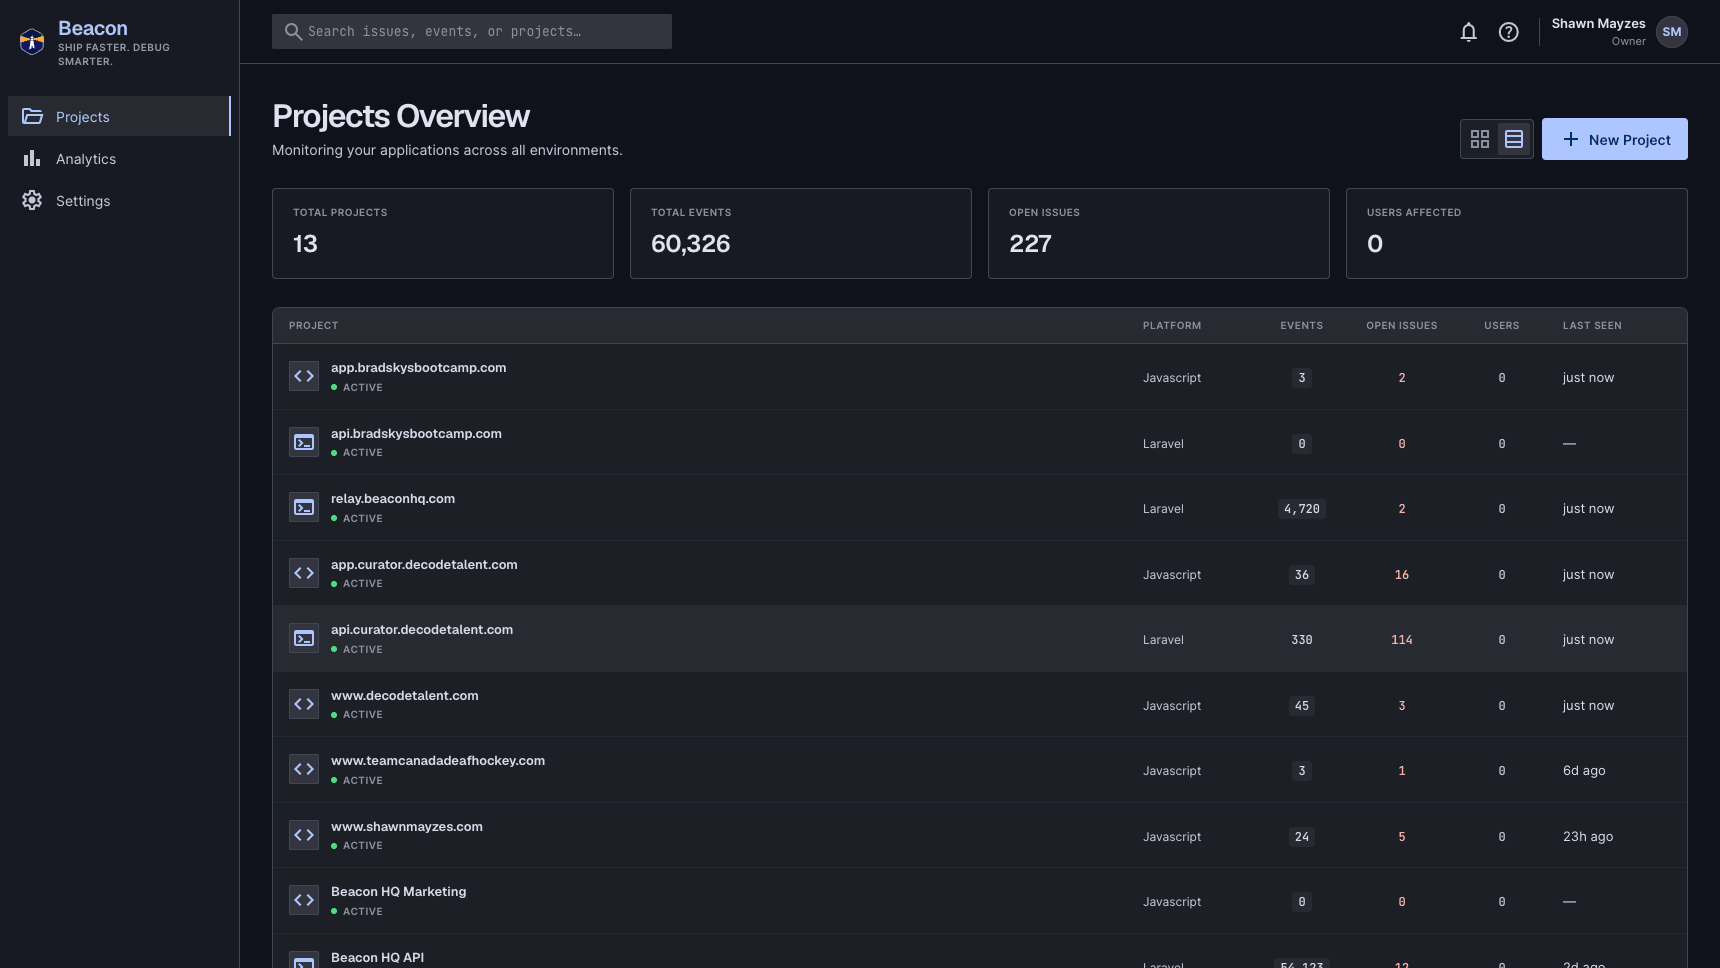
Key modules shipped:
- Error ingest pipeline: fingerprint grouping, breadcrumb capture, source map rewriting at ingest
- Issue states: open, resolved, ignored, muted, with regression tracking across deploys
- Issue workflow: merge, bulk operations, threaded comments, saved views, assignee routing
- Ownership rules: glob-pattern file path matching for automatic issue assignment
- Inbound filters: 4 filter types to suppress bots, extensions, and URL patterns at ingest
- Session replay: structured event stream tied to error events and issue IDs
- User feedback: in-app widget with name, email, and comments linked to the triggering error
- HTTP uptime monitors with configurable intervals, timeouts, and expected status codes
- Cron heartbeat monitors with grace period tracking
- All 7 Core Web Vitals with per-URL and per-release tracking and good/needs-improvement/poor ratings
- Release health: per-deploy issue counts, regression detection, affected user tracking
- Alert rules: first occurrence, regression, event threshold triggers; Slack and webhook channels
- Public status pages per project (no auth required)
- Cookie-free analytics with sessionStorage sessions (no tracking cookies)
- UTM tracking, geo data, device data, scroll depth, returning visitor detection
- Realtime visitor dashboard (active users and top pages, last 5 minutes)
- Pre-aggregated analytics rollups for query performance at scale
- Custom event tracking
- 5 SDKs: Browser JS, PHP, Laravel, Node.js, Python
- Relay layer for edge or IP-restricted ingest deployment
- Real-time dashboard updates via Laravel Reverb WebSockets
- Workspace roles (owner, admin, member) with full data isolation across projects
- Audit log, member invitations, per-user notification preferences
006 The Result
- The full observability stack consolidated from five tools into one platform
- Cookie-free first-party analytics mean no third-party tracking scripts and no cookie consent banner required
- Mean time to reproduce drops significantly: session replay lands on the exact moment of the error, breadcrumbs show everything that led to it, and source maps make the stack trace readable without a separate lookup
- Ownership rules and Slack routing mean the right engineer gets the alert, not just whoever is watching #general
- Release health and web vitals per deploy surface regressions the moment they land, not after users report them
- Five SDK languages cover the full instrumentation surface with zero-dependency, consistent APIs
- The relay architecture supports teams with edge deployment requirements or IP-restricted environments
The platform is live and operating at scale.
BeaconHQ is what a purpose-built observability stack looks like when it is designed around how developers actually work during incidents, not around how many separate tools a vendor can sell you.
BeaconHQ is a Jetpack Labs product. If your platform needs deep technical infrastructure (SDKs, real-time ingest pipelines, multi-tenant data ingestion, or full-stack observability), this is the kind of work we build.
Start a Conversation →